Rachel Phan is a Digital Humanities student at Belmont University.
TimeMapper is a program through Open Knowledge Foundation Labs that allows you to upload spreadsheets to visualize data with timelines and maps. There are a couple of options available on the creation page. You can upload spreadsheets anonymously or with an account. The downside to having an account is that you can only sign in through Twitter, so you would have to create a Twitter account to save and be credited for spreadsheets.
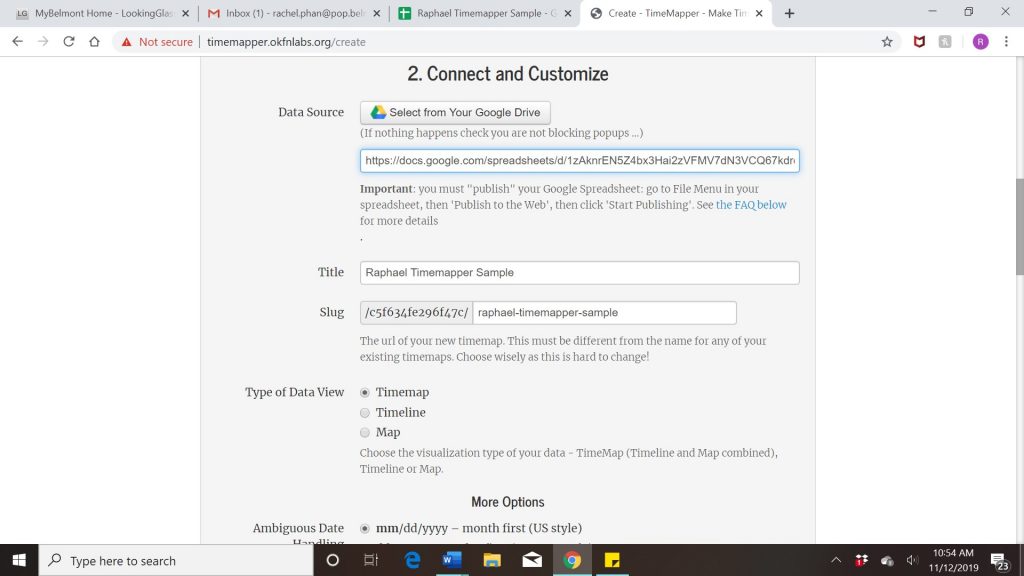
It is really simple to create a TimeMap with their pre-prepared examples because it simply involves them putting in an example spreadsheet URL. From there you can select the title, type of data view, the dating system, and from which event to start.
The TimeMap view is a little confusing and overwhelming at first view because all of the information is presented in one screen. The picture and explanatory text take the biggest chunk of the screen with the scrollable timeline underneath. The map feature is relegated to a small space in the left side. As far as I know, you can’t make any section bigger or smaller, only condense the size of the information in the space. The timeline feature is nice because it shows the dates, and you can scroll based on date or click based on event. The map section is flawed because the points are cluttered in a centralized location but are unable to be fully seen in the small map if they’re spread out. The timeline view is the same as the plain timeline. The map view, while bigger, offers no information on the points being clicked besides the event title. Also, if you zoom out too much, multiple copies of the earth map are laid side-by-side. Overall, the map feature isn’t really well-thought out.
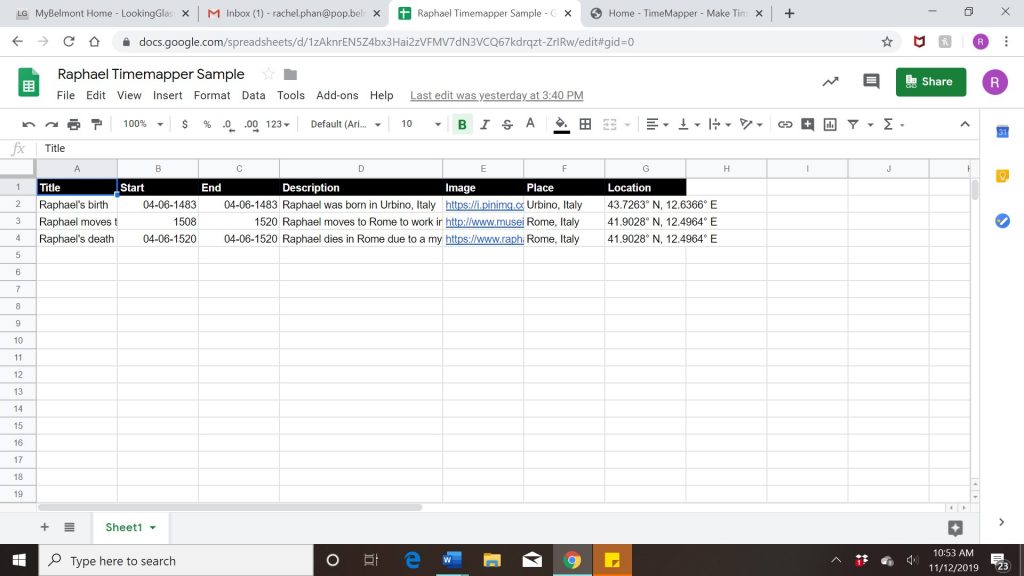
There isn’t anything to the backend because it just simply involves uploading a spreadsheet that’s formatted for the program to use. The tutorial only showed how to upload an existing spreadsheet from Google into the program, and it took me going to the FAQ to find out some info about how to create the actual spreadsheet. The info is very minimal, which makes it harder for someone who hasn’t made a spreadsheet specifically for the program to use.
I created my own simple TimeMap to test the features. I had to continually refer to the tutorial to see how his spreadsheet was formatted to figure out mine because there were no other instructions. Once that was figured, however, I uploaded it, and it worked. There’s no way to customize the map’s looks beyond the type of presentation, but the program is able to take the data and create a TimeMap in seconds, which I found impressive.
There is value to the student because most timelines are educational and provide a way to visualize data in the context of history, but the way information is presented is overwhelming. The timeline itself is fine, but any version of presenting information including the map is either crowded with all the information or lacking with just the map. Besides the timeline, the information presentation is just unappealing. There also aren’t any features to customize the TimeMaps to make them unique, which I found would make for boring presentations. Overall, it’s simple to use once you known how to make the spreadsheet and is a good tool for visualizing data.
How to use:
- Create a spreadsheet in Google Drive with the headings “Title,” “Start Date,” “End Date,” “Description,” “Image,” “Place,” and “Location.”
- Fill in the sheet with the corresponding items under each label. (Note: the dates can be in US or non-US style, but you would have to select that before publishing. Location can be either latitude-longitude coordinates or GeoJSON objects)

- Publish the spreadsheet to the web and then click share to get the URL
- Paste the URL into the data source area when you go to visualize the data.
- Enter a slug for the TimeMap.
- Customize by selecting the type of visualization, the type of dating (US vs non-US), and which event to start from.

- Click publish. You’re done!
My example: http://timemapper.okfnlabs.org/c5f634fe296f47c/raphael-timemapper-sample