Having completed my 160-hour internship with Smithsonian Global and the University of Pennsylvania, it is my pleasure to provide a final reflection and tour of my work on the Conflict Culture project.
Our intern cohort, using excel spreadsheets with partial data, were assigned countries such as Morocco, Finland, Poland, Denmark, and Ireland. I was assigned Ireland and worked on this data set throughout the semester. In addition to research and data entry, our group created a test map component using Google Fusion.
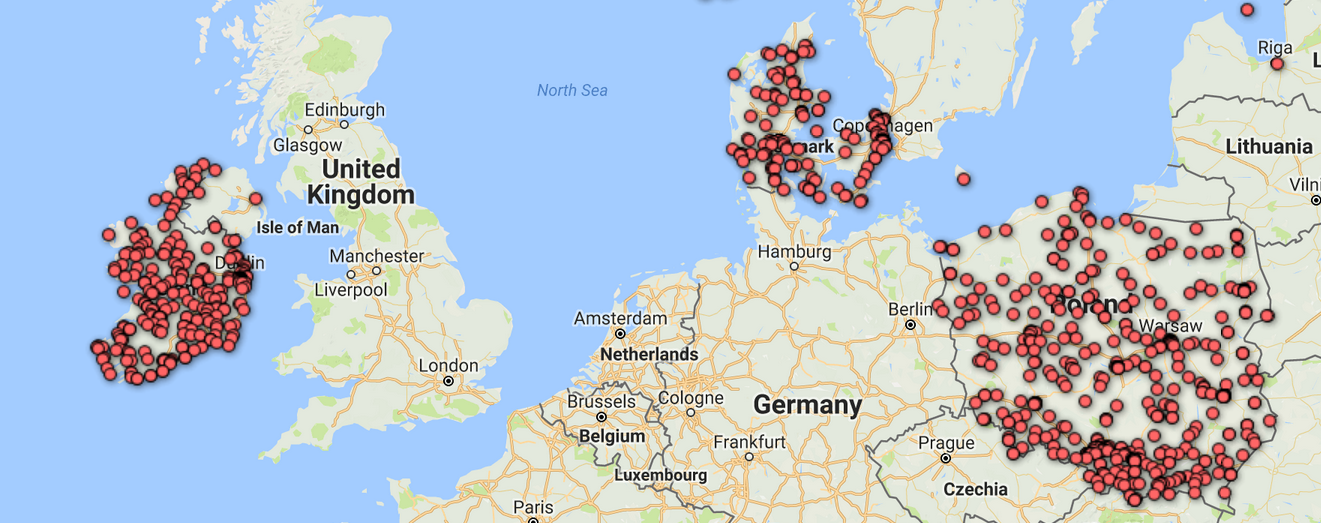
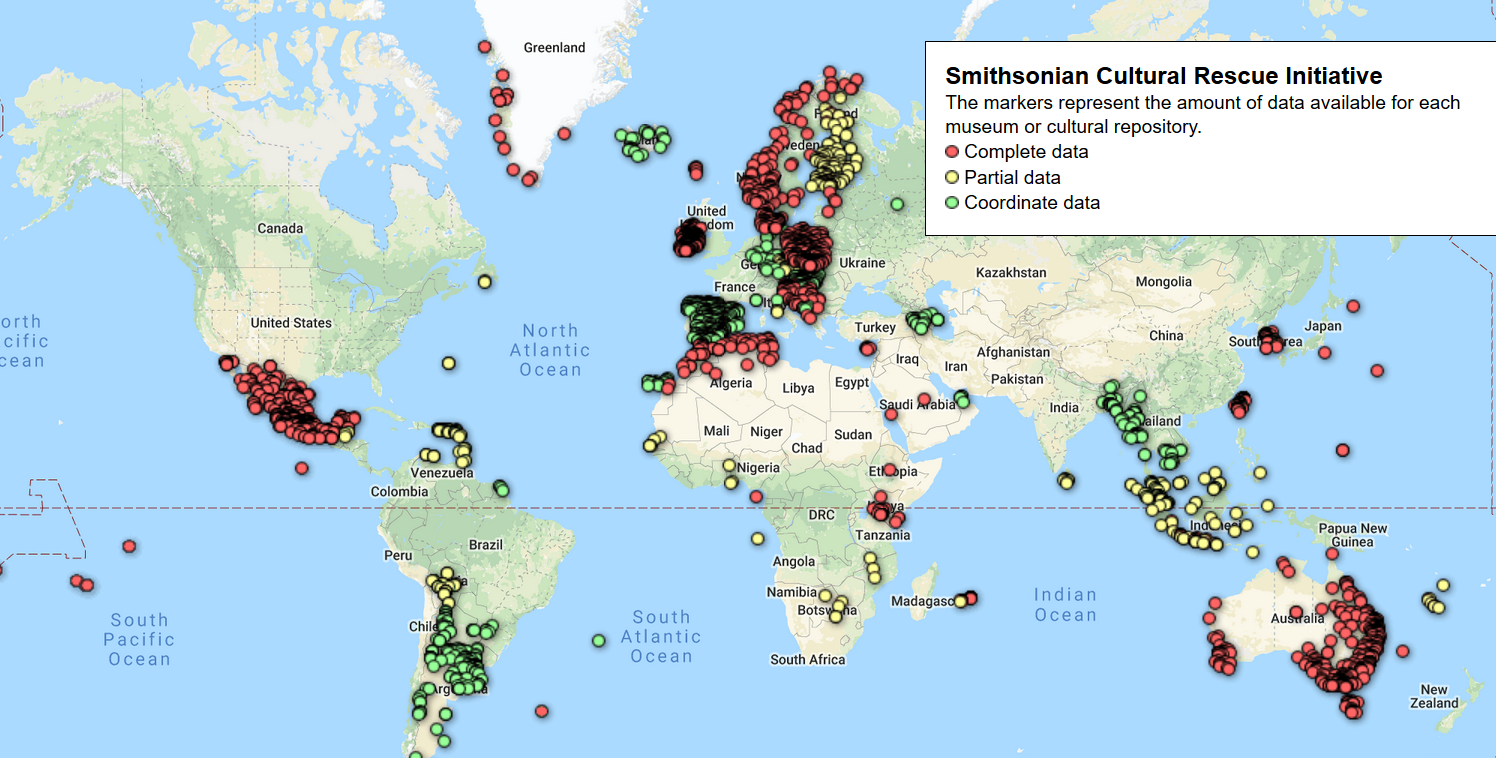
These datasets and maps will be used for multidisciplinary research on cultural heritage in order to prevent intentional destruction, assist in recovery following natural disasters, and generally protect historical sites as well as the collections of museums and archives. At this time, we were unable to create a “clustering” function and so the map appears quite busy when zoomed out.

The final product, however, once the user drills down and clicks on a data point, is a pop-up window with all relevant information for each site (above). Our group selected not to show some of the coding that would not be meaningful to a general audience at this time. For example, we coded each entry to show whether the site was state-sponsored and/or prior military function. We also ranked its significance as 1-international, 2-national, or 3-local. Our group discussed different ways to represent this information and it was determined that, at a later date, the Smithsonian can choose to color code these or build additional layers. We did color code sites based on complete, partial, or coordinate-only data (below).
Uploading the data was fairly simple, the excel was saved as a CSV file. A CSV stands for comma separated values file, which allows data to be saved in a table structured format. CSVs look like an excel spreadsheet but have .csv extension instead of .xlsx. A CSV takes the form of a text file containing “information separated by commas,” for which it is named.
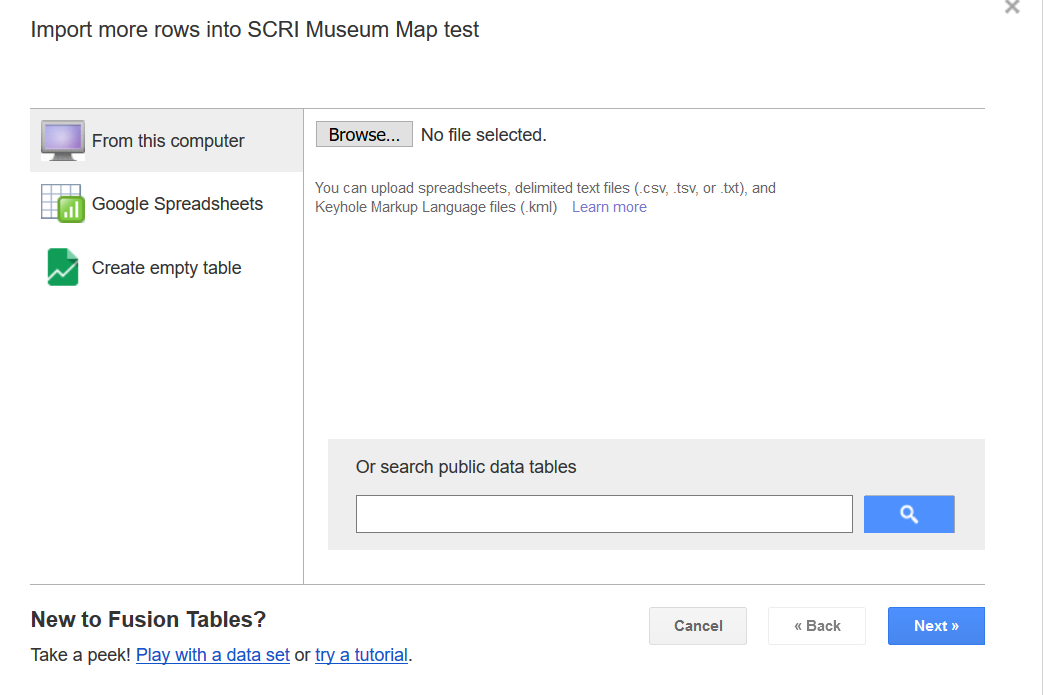
From the file menu, users select import rows, which is followed with the following screen. From here, the user can upload the file from their computer, link a Google spreadsheet, or build a table from scratch (above).
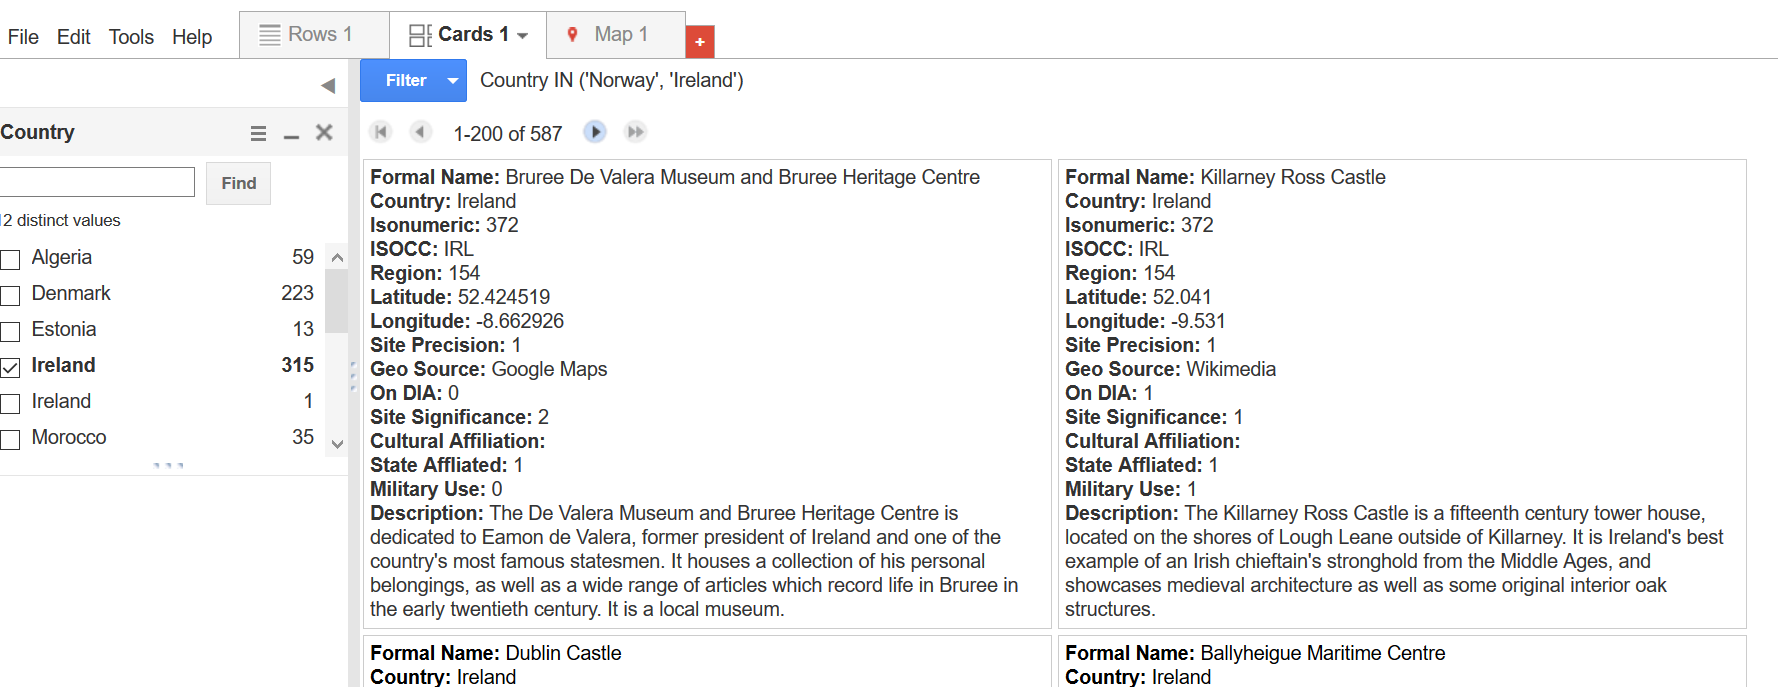
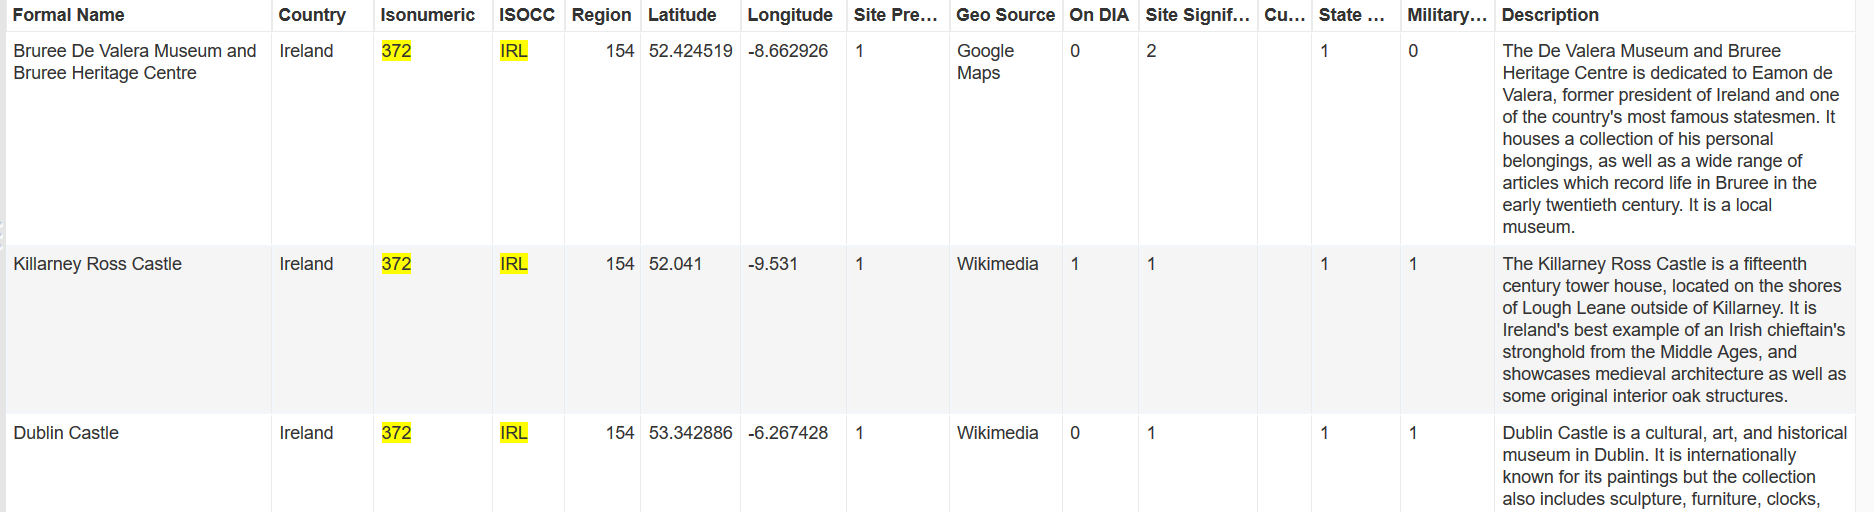
Once uploaded the data sheet could be viewed as rows (below) or cards (above). We used a cultural repository code book and instruction manual provided by Smithsonian Institution. My research focused on Ireland’s sites related to the cultural heritage, which include: historic sites, religious sites, libraries with exhibits, archives, art galleries, museums, and archaeological sites. Historians are rarely short-winded when writing; thus, it required work and discipline to properly code and describe in 25-30 words each site/entry. I gained experience in using scientific methods to integrate qualitative information into a standard frame of variables and data formatting.
This is a great and worthy project. Through this research, I gained a deeper appreciation for the importance and complex interpretations of cultural heritage. I also see this as a way to elevate traditional museum/archive/site indexes so that they are more accessible and visual for scholars, hobbyists, students, national and international bodies, and the larger global community.
My DH skills, gained through George Mason’s post-graduate DH certificate program, came into play on several occasions. I understood the importance of controlled vocabulary, metadata, and DH tools and terms needed to ask and answer questions. As far as digital skills gained, I learned the basics of using and working with Google Fusion. On a personal level, I learned a great deal about the rich history of Ireland from Dublin Castle to the National Leprechaun Museum. With over 300 cultural heritage sites, I will surely build my next trip itinerary to Ireland around my work on Conflict Culture.