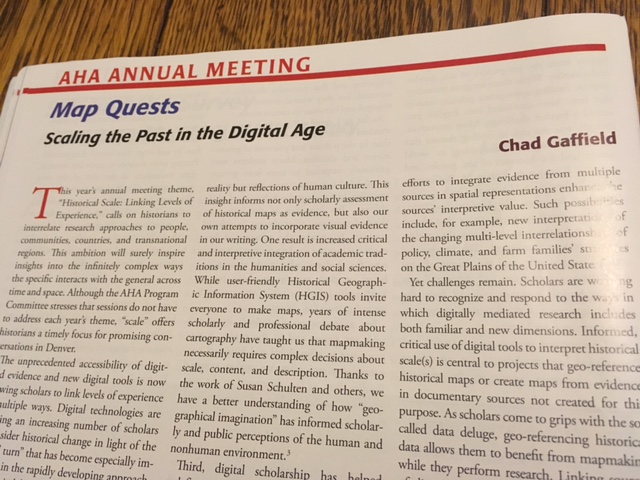
Once again, the timing of HIST680 is impeccable. I had just finished reviewing CartoDB when I went to my mailbox and pulled out this month’s Perspectives published by the AHA. The topic of one of the feature articles? You guessed it: digital mapping.
This simply reinforces my belief that taking this course and participating in the DH Certificate Program through GMU was not only a good decision, but a great one. Now onto my review….

CartoDB (created by Vizzuality) is an open-source, online, cloud-based software system that is sure to please anyone seeking to visualize and store data using geospatial mapping. Basic usage is free with an account; however, better and expanded options are available with a paid subscription. The company also provides support and custom mapping for an additional fee. The free account is accompanied by 50mb of storage, and data can be collected and directly uploaded from the web and accessed via desktop, laptop, tablet, or smart phone. Part of what makes CartoDB so intuitive is its user-friendly interface. Users can upload files with a simple URL cut/paste or file drag/drop. The program also accepts many geospatial formats, such as excel, text files, GPX, and other types of shapefiles, making CartoDB useful for humanities and STEM-related disciplines alike. Once multiple data layers are uploaded users can create a visualization and manipulate this visualization through several modes: heat, cluster, torque, bubble, simple, and others. Once the visualizations have been organized and customized, CartoDB also provides convenient options to provide links and embed codes to share the map. Finally, CartoDB does a great job answering questions with online tutorials, FAQs, and “tips and tricks.” Google maps first ventured into web-based mapping tools, but CartoDB takes it to a whole new level.
Our activity involved using data from the WPA Slave Narratives, and it was a great hands-on exercise to discern the types of information and conclusions that can be drawn by viewing information geospatially. By visualizing the location of interviews it works much like Photogrammar (Module 8), which allows users (teachers and students alike) to see several patterns: travel, chronological, and the geographical concentration of interviews in particular areas of Alabama.
While our class activity provided the data, I am anxious to experiment with data that I have collected myself. For example, I am working on images and maps for a recent manuscript, I have the addresses for several colleges and universities in Nashville. I received an email last week from the press that said they were unable to take my historical maps and provided layered data which would show the relationship between the location of institutions of higher education and the geographical trends of urban growth in Nashville from 1865 to 1930. I look forward to using CartoDB in the future.