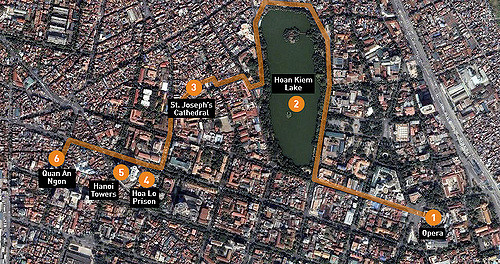
Nam-ho Park, “A Half-Day Walk through Hanoi,” CC license
There are many implementations and activities that can connect the public to public history using online digital collections. As “read-write web.” The Web 2.0 (or 1.5 as they call it) allows public historians to collect and share the stories and narratives of people through their direct participation. Digital history project also benefit from the volunteer efforts of people to identify and enhance their narratives, help to piece together the narratives of others, and provide valuable information and context.
A great example of this can be found in the project “Invisible Australians” that used a facial detection script, tagging, photos, and people to analyze the “White Australia Policy.” Other successful crowdsourcing and public history collaborations include Flickr Commons, created as a “forum for institutions to share their rich photographic collections. . . and provide insights into how knowledge, skill, and abilities of librarians, archives, and museums can converge in the Web 2.0 environment to provide collection access to new. . . audiences,” (Smithsonian Team Flickr). The Smithsonian Institute’s collaboration is sharing its rich photo archive with Flickr Commons has created an amazing public-private partnership.
In this spirit, the following list includes the kinds of public history implementations and activities that having a basic digital collection enables.
- Tagging, Identification
- Transcribing
- Exploration
- Social Media
- Contests
- Visual analysis
- Direct Collaboration
- Geo-spatial mapping (see image at top of post)
- Memory-making
- Storytelling
Omeka has emerged as the premier platform for open-source digital public history projects. With a variety of templates, plug-ins, and customization options, most of the items on the above list can be achieved using Omeka’s open source web platform. For my own project, I will be able to use information from and about historical markers in Nashville’s downtown core. This includes temporal and geographic locations, marker text, and related primary sources. These resources could ultimately be used to create explorations via walking tours, contests for users, storytelling via historical contextualization, direct user collaboration via tagging or identification, and social media. While many of these goals remain quite distant, the fluid nature of DH and the trajectory of rapidly advancing technology make these goals possible.
It remains important to consider several factors that remain critical to the long term usefulness, credibility, and sustainability of digital archives. First archival projects need to be clearly identified. There are many genres and meanings of the word “archive” as noted by Trevor Owen. Ranging from a records or storage management system to what some critics call “artificial collections,” properly defining the mission, scope, and function of an a digital archive is essential (What Do you Mean by Archive?). Likewise the issue of metadata is important. Metadata is not always exciting on its face, but it provides the foundation on which successful digital history projects depend. As the guide for “Describing Metadata” suggests: “Metadata is the glue which links information and data across the world wide web. It is the tool that helps people to discover, manage, describe, preserve and build relationships with and between digital resources” (Describing Metadata).
Coupled with high standards of historical scholarship, digital projects can produce and make available large collections that can be used to disseminate and distribute information to the greater public while also providing countless primary sources to current and future historians. As Dan Cohen and Roy Rosenzweig emphasized in Digital History, “Collecting history through digital archives can be far cheaper, larger, more diverse, and more inclusive than traditional archives. This democratization however, does not mean compromising the quality of the historical work.” (Why Collecting History Online is 1.5).
Works Cited:
Brennan, Sheila A., and T. Mills Kelly. “Why Collecting History Online is Web 1.5” Roy Rosenzweig Center for History and New Media. 2009.
JISC Digital Media. “Metadata: An Introduction.” (first section – “From Metadata: a definition” to “Metadata often reflects the community it has come from.”
Kalfatovic, Martin et al. “Smithsonian Team Flickr: a library, archives, and museums collaboration in web 2.0 space.” Archival Science (October 2009).
Owens, Trevor. “What Do You mean by Archive? Genres of Usage for Digital Preservers.” The Signal: Digital Preservation (blog), February 27, 2014.
Sherratt, Tim. “It’s All About the Stuff: Collections, Interfaces, Power, and People.” Journal of Digital Humanities 1.1 (Winter 2011).